Plots


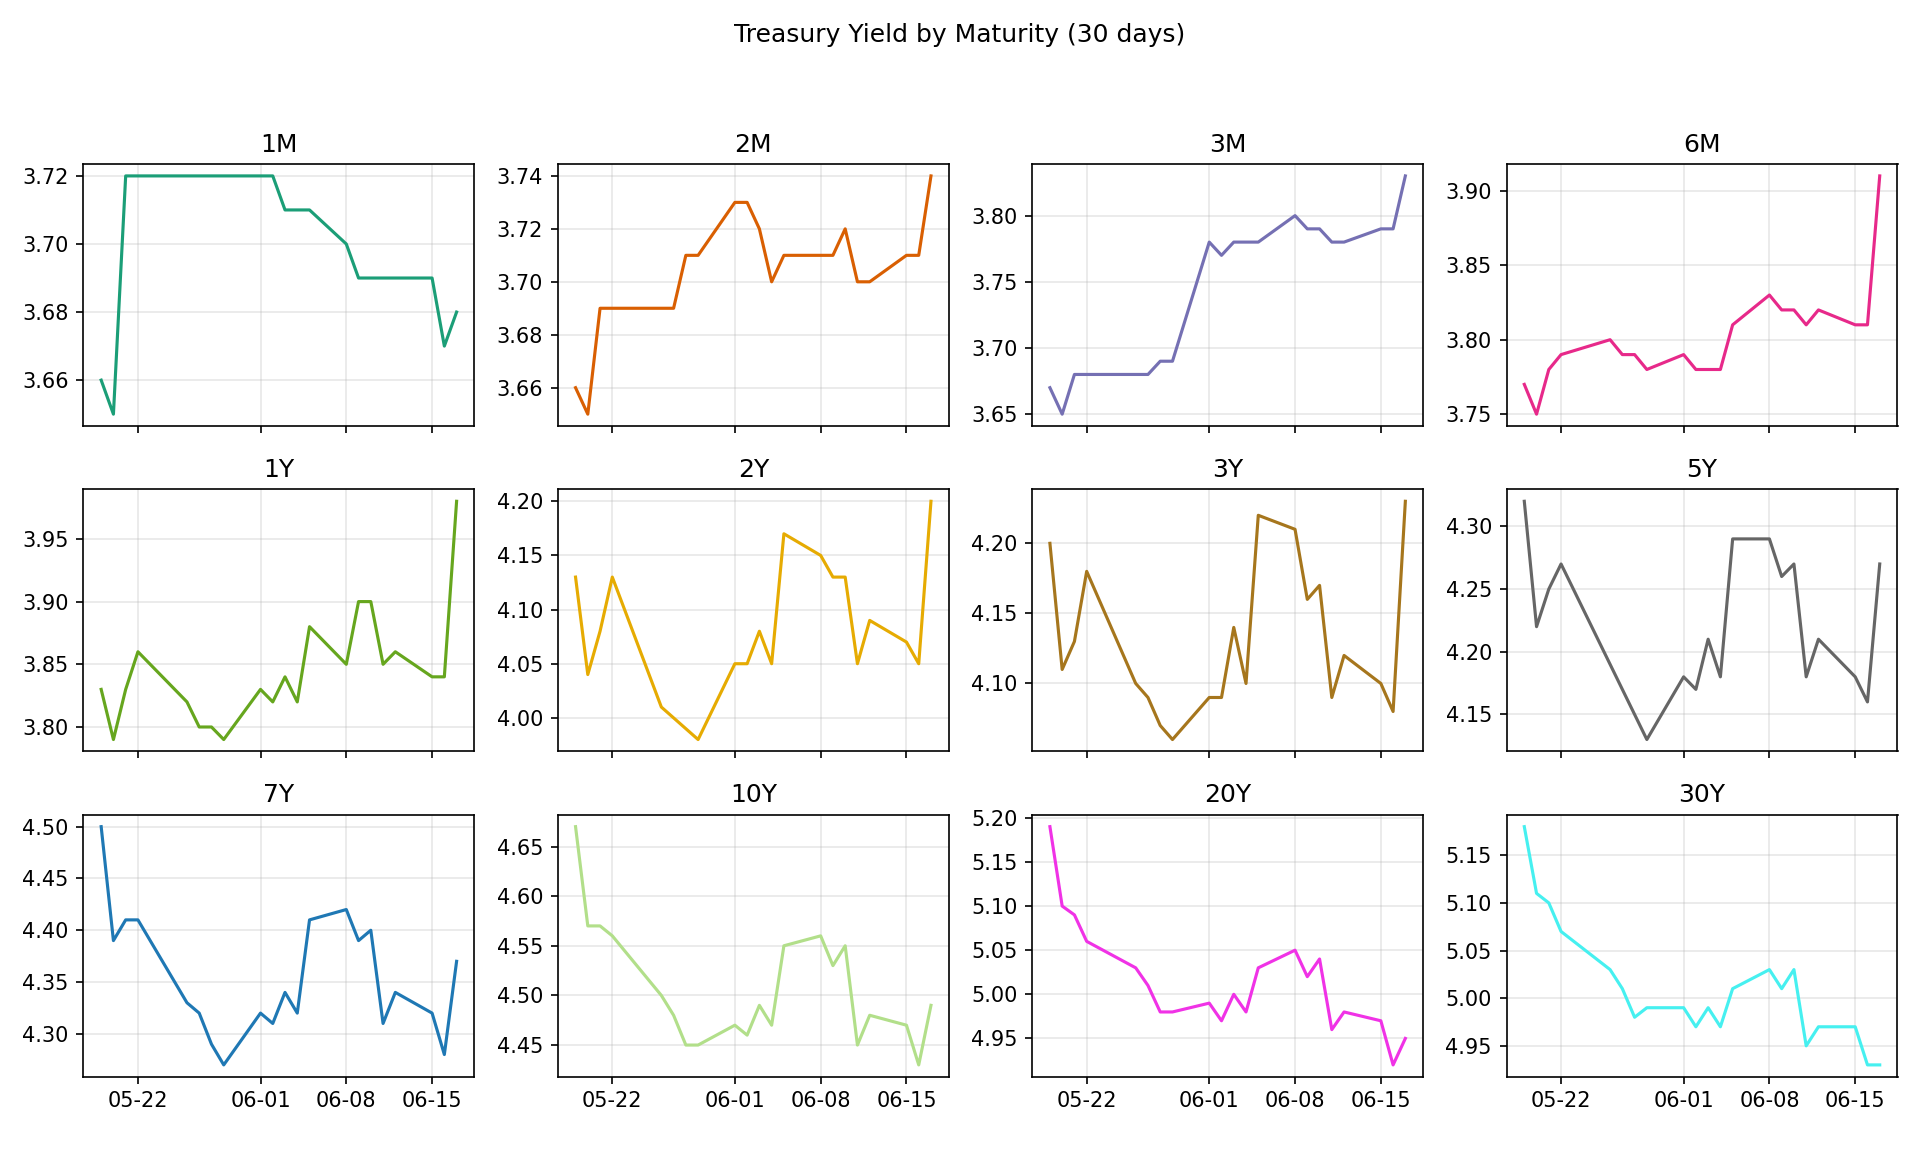
Summary for 2026-06 (latest data 2026-06-17)
Highest current yield: 20Y (@ 4.95%)
Best annualized yield: 20Y (@ 4.95%/yr)
Best trend-adjusted yield: 20Y (@ 4.96%)
Best overall (composite): 20Y
Trend notes (bps/month, higher = rising yields):
- 1M: -8.1 bps/mo (R²=0.90), curr 3.68%
- 2M: -0.8 bps/mo (R²=0.01), curr 3.74%
- 3M: +5.3 bps/mo (R²=0.42), curr 3.83%
- 6M: +13.0 bps/mo (R²=0.49), curr 3.91%
- 1Y: +12.7 bps/mo (R²=0.27), curr 3.98%
- 2Y: +8.1 bps/mo (R²=0.08), curr 4.20%
- 3Y: +4.1 bps/mo (R²=0.02), curr 4.23%
- 5Y: +2.2 bps/mo (R²=0.01), curr 4.27%
- 7Y: -1.3 bps/mo (R²=0.00), curr 4.37%
- 10Y: -3.6 bps/mo (R²=0.02), curr 4.49%
- 20Y: -9.0 bps/mo (R²=0.19), curr 4.95%
- 30Y: -8.8 bps/mo (R²=0.23), curr 4.93%